Most of the time, the Plan Visualizer is sufficiently powerful to understand what is going on inside of SAP HANA when you run a query. However, sometimes you need to get to a lower level of detail to understand exactly what is going on in the calculation engine.
It is then possible to use HANA Studio to record performance traces, and analyze them with HDBAdmin. This is a fairly advanced topic, so beware!
First, let's pick a query which runs slowly. This query takes 12 seconds, which is longer than I'd like. Admittedly, it's a tough query, grouping 1.4bn transactions and counting over 2m distinct customers.
We can double click on our HANA system in the HANA systems view, which will bring up the HANA Overview. Select Trace Configuration.
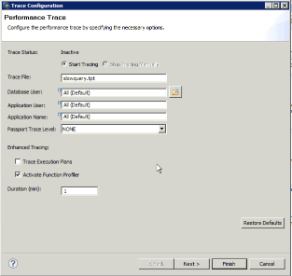
Now select the little edit button, next to the Performance Trace. Give your trace a name - I called it slowquery.tpt, and optionally select your username as a restriction, if you're sharing the system. You don't want to be doing anything else with this user whilst you run this query. You need to select a duration - 60 seconds is enough for me.
Select Finish, and immediately go and rerun your query. You can go and disable the performance trace in the same place, or you can just wait for the time to expire if you're not doing anything else.
Now, we need to go and get some software. You need two things - an X-Windows Client and a SSH client. If you are using MS Windows then I highly recommend Xming and PuTTY - other software usually causes problems. Go ahead and download and install them. When you run Xming, you will see an X appear in your task bar. Hover over it - and you should see that it shows Xming Server:0.0. If it doesn't show 0.0, take a note of what it says.
Now, you need to fire up PuTTY. PuTTY doesn't come with an installer - it's just a single executable, and it will bring up a configuration window like this:
Put your HANA hostname or IP in "hostname". Then select Connection -> SSH -> X11. Tick Enable X11 forwarding and type localhost:0.0 (or whatever number Xming displayed) in the X display location. This enables putty to know that we have an X server running on our local machine, and tell HANA about this.
Go back to the Session tab on the left, type a name for your session (I called it HANA) and select Save. Now select Open.
PuTTY should connect to your HANA system. You MUST now login as the correct HANA admin user - hdbadm in my case. This is critical.
Now we can do two things just to check things are good.
1) echo $DISPLAY - this shows us that we have the display correctly set. Note that it shows localhost:10.0 - that's just PuTTY taking care of X11 for us. Good.
2) xclock - this is the tried and tested way to check that X11 is functioning. You may see an Xming at the bottom of your screen and have to select that before you see the clock. Close the clock once it comes up - we are now good.
You can go right ahead and type ./HDBAdmin.sh, and HDBAdmin should now open.
Unfortunately HDBAdmin doesn't work out the box (not sure why) and you have to install the Emergency Support Package, the first time you run it. We do this with 4 little commands:
1) cd exe
2) sudo tar zxvf /usr/sap/HDB/SYS/global/hdb/emergency/emergencySupport.tgz .
3) sudo chown hdbadm.sapsys AttributeEnginePy.so _fuzzyPy.so executorPy.so
4) cd ..
This moves us into the executables folder, extracts the emergency support library as a superuser (you will need the root password) and then changes the permissions so the HANA user is the owner. Note that I used SID HDB, which is the name for my system. Yours will be different.
Now you can go ahead and rerun ./HDBAdmin, and it will run without errors.
Select More, which will prompt you to move to Advanced Mode, and then Perf. Trace. We are now in the right mode to open our query. Finally!
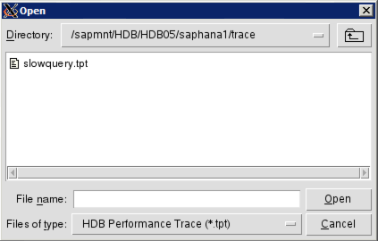
Select the Load button, and then double click on your machine name (saphana1), and then double click on the trace folder. You should now see your performance trace appear. Select your trace and select Open.
Your performance trace is now opened. Select Call plans, and you should see your slow-running query. Double click on it.
Interestingly, the trace shows in this case that the cost is in merging dicts and aggregating in parallel. This system has a large number of partitions on the table (60) and there is a cost in doing a count distinct in each partition, and then remerging them. Perhaps a simpler partition strategy or one with the CUSTOMER_ID field as a hash, would reduce the cost of this query. I'll give that a go.
Final Words
The HDBAdmin tool is a legacy tool which is incredibly powerful, but not that easy to use. The PlanViz tool inside HANA Studio is much easier to use and easier to understand.
But, if you are stuck and you need to get into the depths of query execution in HANA, HDBAdmin is a very powerful tool.
Source: scn.sap.com


