Introduction
In this exercise, I’ll give a walkthrough on how to perform a top down investigation on high & peak HANA memory usage and its associate top memory consumers with the aid of HANA SQL scripts attached to SAP Note 1969700 – SQL Statement Collection for SAP HANA and Statistics data (History / Current) collected by ESS / SSS (Mandatory. Recommended retention = 49 days)
I’m taking below example where I was asked to perform a memory analysis on a productive system where there was a spike of peak memory usage, around 5.9TB.
Since the system is running on scale out environment, I will breakdown the analysis of each memory usage of each node:
Below we noticed that the node01 and node02 are one of those nodes with high peak used memory.
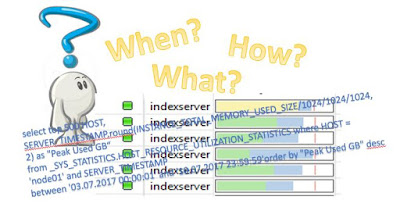
Thus, in this content, I’ll show the memory analysis on node01 and node02 by using the 3 simple questions as quick start, where it provides us a clearer direction moving forward:
- When was the specific time that the peak usage happened?
- What were those top memory consumers during peak usage?
- What were the running processes/ threads during the peak usage?
Node01:
When was the specific time that the peak usage happened?
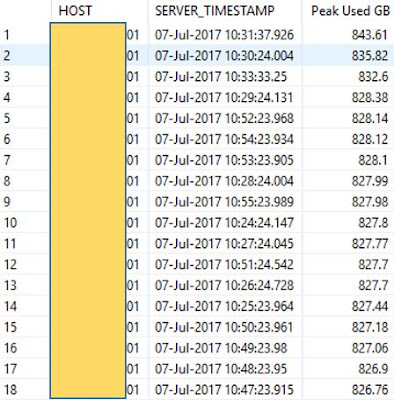
First, we need to find out the specific day/ time the peak memory happened.
For my case, I knew the peak memory was occurred last week, and hence, I’m using the past week timestamp and below SQL script to figure the exact day/time of the peak memory.
select top 500 HOST, SERVER_TIMESTAMP,round(INSTANCE_TOTAL_MEMORY_USED_SIZE/1024/1024/1024, 2) as “Peak Used GB” from _SYS_STATISTICS.HOST_RESOURCE_UTILIZATION_STATISTICS where HOST = ‘node01’ and SERVER_TIMESTAMP between ‘03.07.2017 00:00:01’ and ‘10.07.2017 23:59:59’order by “Peak Used GB” desc
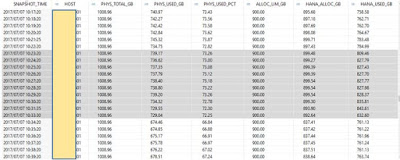
In addition, you can also utilize script HANA_Resources_CPUAndMemory_History_1.00.74+_ESS attached to note 1969700 if you want to further break down the memory usage of the day: –
( SELECT /* Modification section */
TO_TIMESTAMP(‘2017/07/07 08:00:01’, ‘YYYY/MM/DD HH24:MI:SS’) BEGIN_TIME,
TO_TIMESTAMP(‘2017/07/07 23:59:59’, ‘YYYY/MM/DD HH24:MI:SS’) END_TIME,
‘node01’ HOST,
‘ ‘ ONLY_SWAP_SPACE_USED,
-1 MIN_MEMORY_UTILIZATION_PCT,
-1 MIN_CPU_UTILIZATION_PCT,
‘X’ EXCLUDE_STANDBY,
‘TIME’ AGGREGATE_BY, /* HOST, TIME or comma separated list, NONE for no aggregation */
‘TS30’ TIME_AGGREGATE_BY, /* HOUR, DAY, HOUR_OF_DAY or database time pattern, TS<seconds> for time slice, NONE for no aggregation *
‘TIME’ ORDER_BY /* TIME, HOST */
FROM
DUMMY
What were the top memory consumers during peak usage
We’ve narrowed down the time where peak memory happened, now let’s investigate what were those top memory components used on node01 with below script:
– HANA_Memory_TopConsumers_History_1.00.90+_ESS with the selection specific on time 09:00 – 10:35 on node01. You may want to adjust the modification section based on your situation.
( SELECT /* Modification section */
TO_TIMESTAMP(‘2017/07/07 09:00:00’, ‘YYYY/MM/DD HH24:MI:SS’) BEGIN_TIME,
TO_TIMESTAMP(‘2017/07/07 10:35:00’, ‘YYYY/MM/DD HH24:MI:SS’) END_TIME,
‘node01’ HOST,
‘%’ PORT,
‘%’ SCHEMA_NAME,
‘%’ AREA, /* ROW, COLUMN, TABLES, HEAP, % */
‘%’ SUBAREA, /* ‘Row Store (Tables)’, ‘Row store (Indexes)’, ‘Row Store (Int. Fragmentation)’, ‘Row Store (Ext. Fragmentation)’, ‘Column Store (Main)’, ‘Column Store (Delta)’, ‘Column Store (Others)’ or ‘Heap (<component>)’ */
‘%’ DETAIL, /* Name of table or heap area */
‘ ‘ ONLY_SQL_DATA_AREAS,
‘ ‘ EXCLUDE_SQL_DATA_AREAS,
200 MIN_TOTAL_SIZE_GB,
‘USED’ KEY_FIGURE, /* ALLOCATED, USED */
‘%’ OBJECT_LEVEL, /* TABLE, PARTITION */
‘ ‘ INCLUDE_OVERLAPPING_HEAP_AREAS,
‘DETAIL’ AGGREGATE_BY, /* SCHEMA, DETAIL, HOST, PORT, AREA, SUBAREA */
‘NONE’ TIME_AGGREGATE_BY /* HOUR, DAY, HOUR_OF_DAY or database time pattern, TS<seconds> for time slice, NONE for no aggregation */
*The output of the above script gives us an overview of top memory components used, but not the total memory used as allocated shared memory is not included and HOST_HEAP_ALLOCATORS only contains allocators with INCLUSIVE_SIZE_IN_USE > 1 GB, so the sum of used memory displayed is smaller than expected. Don’t be surprised if the total memory on top consumer returned doesn’t match the peak memory usage.
From above, we’ve identified the top contributors were Pool/PersistenceManager/PersistentSpace/DefaultLPA/*, and we know the functionality of this heap allocator is to cache virtual file pages to enhance IO related performance (savepoint, merges, LOB, etc) and make better use of available memory. Thus, once used, they will remain in memory, be counted as “Used memory”, and HANA will evict them only if the memory is needed for other objects, such as table data or query intermediate results. This is the general design of HANA and not critical. Our system is not affected by any bugs since we are on rev122.09 and memory should be reclaimed when needed as we don’t see any OOM trace on the system.
You can always refer to 199997 – FAQ: SAP Memory to have better overview on the purpose of each memory components/ allocators.
With above walkthrough, it should give you a clearer picture on how to:
- Identify the day/ time when high memory usage occurred
- Identify what’s the top memory consumers during the high memory usage incident
Next, I’ll use the same approach to perform the peak memory RCA on node02
Node02
When was the specific time that the peak usage happened?
I’m using below SQL to find out the when’s the peak memory happened, time range from the last system restart until current: 18.06.2017 – 10.07.2017
select top 500 HOST, SERVER_TIMESTAMP,round(INSTANCE_TOTAL_MEMORY_USED_SIZE/1024/1024/1024, 2) as “Peak Used GB” from _SYS_STATISTICS.HOST_RESOURCE_UTILIZATION_STATISTICS
where HOST = ‘node02’ and SERVER_TIMESTAMP between ‘18.06.2017 00:00:01’ and ‘10.07.2017 23:59:59’
order by “Peak Used GB” desc
As an example, I’ll focus on the top memory consumer happened on 1st July, between 10:00AM – 11:00AM
What were the top memory consumer during peak usage
Again, using script – HANA_Memory_TopConsumers_History_1.00.90+_ESS and adjusting the modification section:
( SELECT /* Modification section */
TO_TIMESTAMP(‘2017/07/01 10:00:00’, ‘YYYY/MM/DD HH24:MI:SS’) BEGIN_TIME,
TO_TIMESTAMP(‘2017/07/01 11:00:00’, ‘YYYY/MM/DD HH24:MI:SS’) END_TIME,
‘node02’ HOST,
‘%’ PORT,
‘%’ SCHEMA_NAME,
‘%’ AREA, /* ROW, COLUMN, TABLES, HEAP, % */
‘%’ SUBAREA, /* ‘Row Store (Tables)’, ‘Row store (Indexes)’, ‘Row Store (Int. Fragmentation)’, ‘Row Store (Ext. Fragmentation)’, ‘Column Store (Main)’, ‘Column Store (Delta)’, ‘Column Store (Others)’ or ‘Heap (<component>)’ */
‘%’ DETAIL, /* Name of table or heap area */
‘ ‘ ONLY_SQL_DATA_AREAS,
‘ ‘ EXCLUDE_SQL_DATA_AREAS,
100 MIN_TOTAL_SIZE_GB,
‘USED’ KEY_FIGURE, /* ALLOCATED, USED */
‘%’ OBJECT_LEVEL, /* TABLE, PARTITION */
‘ ‘ INCLUDE_OVERLAPPING_HEAP_AREAS,
‘DETAIL’ AGGREGATE_BY, /* SCHEMA, DETAIL, HOST, PORT, AREA, SUBAREA */
‘TS30’ TIME_AGGREGATE_BY /* HOUR, DAY, HOUR_OF_DAY or database time pattern, TS<seconds> for time slice, NONE for no aggregation */
FROM
DUMMY
During this specific timeframe, Poo/itab was the top consumer followed by some large table/partition on the system. FYI, Poo/itab is a temporary SQL area to store column store intermediate search results.
Since we’ve identify the top memory consumer, and now let’s find out what’s the thread/process running on that period.
What were the running processes/ threads during the peak usage?
Identify the running thread and process that possibly causing the high memory usage with script
HANA_Threads_ThreadSamples_FilterAndAggregation_1.00.120+
SELECT /* Modification section */
TO_TIMESTAMP(‘2017/07/01 10:00:00’, ‘YYYY/MM/DD HH24:MI:SS’) BEGIN_TIME,
TO_TIMESTAMP(‘2017/07/01 11:00:00’, ‘YYYY/MM/DD HH24:MI:SS’) END_TIME,
‘node02’ HOST,
‘%’ PORT,
-1 THREAD_ID,
‘%’ THREAD_STATE, /* e.g. ‘Running’, ‘Network Read’ or ‘Semaphore Wait’ */
‘%’ THREAD_TYPE, /* e.g. ‘SqlExecutor’, ‘JobWorker’ or ‘MergedogMonitor’ */
‘%’ THREAD_METHOD,
‘%’ THREAD_DETAIL,
‘%’ STATEMENT_HASH,
‘%’ STATEMENT_ID,
‘%’ STATEMENT_EXECUTION_ID,
‘%’ DB_USER,
‘%’ APP_NAME,
‘%’ APP_USER,
‘%’ APP_SOURCE,
‘%’ LOCK_NAME,
‘%’ CLIENT_IP,
-1 CLIENT_PID,
-1 CONN_ID,
-1 MIN_DURATION_MS,
80 SQL_TEXT_LENGTH,
‘X’ EXCLUDE_SERVICE_THREAD_SAMPLER,
‘X’ EXCLUDE_NEGATIVE_THREAD_IDS,
‘X’ EXCLUDE_PHANTOM_THREADS,
‘NONE’ AGGREGATE_BY, /* TIME, HOST, PORT, THREAD_ID, THREAD_TYPE, THREAD_METHOD, THREAD_STATE, THREAD_DETAIL, HASH, STATEMENT_ID, STAT_EXEC_ID, DB_USER, APP_NAME, APP_USER,APP_SOURCE, CLIENT_IP, CLIENT_PID, CONN_ID, LOCK_NAME or comma separated combinations, NONE for no aggregation */
‘MAX’ DURATION_AGGREGATION_TYPE, /* MAX, AVG, SUM */
-1 RESULT_ROWS,
‘HISTORY’ DATA_SOURCE /* CURRENT, HISTORY */
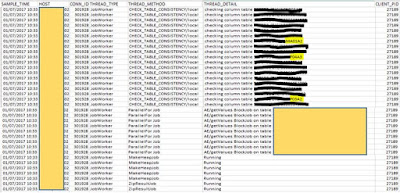
From the result above we’ve identified that CHECK_TABLE_CONSISTENCY was the culprit of the high memory usage.
CHECK_TABLE_CONSISTENCY is an CPU and memory intensive job, especially for large column store tables the consistency check requires a lot of memory. This make sense as currently checking column tables (*MA01A2, *MP03A2, etc) are those of the largest tables and top consumers in the system.
From the investigation, I also learnt that Poo/itab was used to store the immediate result of the consistency check table and threads like “MakeHeapJob”, “ZipResultJob”, “search”, “ParallelForJob” were called to perform parallel sorting operation or parallel processing of input data during Table consistency check.
