Since its introduction in 1.0 SP 12, the streaming plugin for SAP Web IDE has been improving release to release. With 2.0 SP 02 come more new features and enhancements for both the plugin and the streaming runtime tool, which should make your development, administration, and monitoring through these tools just a little bit easier.
Here’s a quick summary of the changes to streaming modules in SAP Web IDE:
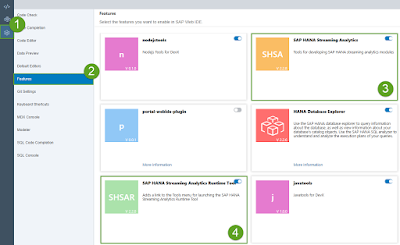
From SP 02 onward, the plugin isn’t automatically enabled once you install everything and set up the streaming service broker. So, if you log into the Web IDE and can’t find streaming modules anywhere, not to worry: you can easily enable the plugin, and the link to the streaming analytics runtime tool, through the Web IDE preferences.
Here’s a quick summary of the changes to streaming modules in SAP Web IDE:
- The streaming plugin isn’t enabled by default anymore – you need to enable it in the Web IDE preferences before creating streaming modules.
- CCL and CCR files inherit the streaming module name.
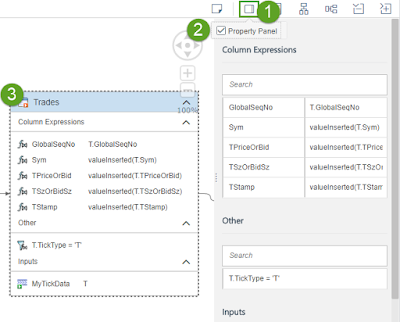
- You can view the preferences for any streaming project element directly in the graphical viewer.
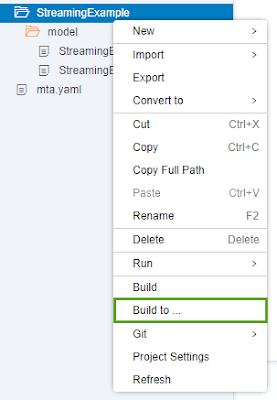
- You can build streaming modules to any custom streaming workspace.
- You can register custom workspaces – that is, add any existing streaming workspace to the tool.
- You can monitor statistics for streams and windows through the monitor.
- You can trace data flow through the event tracer.
Enabling the plugin
From SP 02 onward, the plugin isn’t automatically enabled once you install everything and set up the streaming service broker. So, if you log into the Web IDE and can’t find streaming modules anywhere, not to worry: you can easily enable the plugin, and the link to the streaming analytics runtime tool, through the Web IDE preferences.
CCL and CCR file names
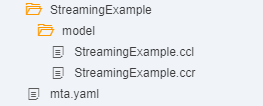
You also don’t need to worry about confusing your multiple “model.ccl” and “model.ccr” files anymore – they now inherit the name of the streaming module.
Properties in the graphical viewer
If you open up the graphical viewer, you’ll notice that there’s a new icon in the toolbar. Clicking this icon opens up the option to turn on the properties pane. Then, when you select any element in the graphical viewer, the properties for that element show up in the pane.
Building streaming modules to custom workspaces
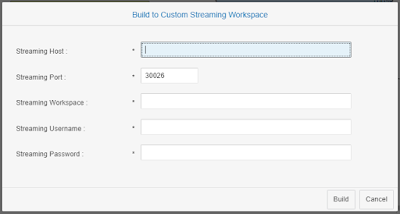
Here’s arguably the most important feature for streaming modules in this release: building streaming modules to any streaming workspace, on any streaming server (as long as you have access to it – make sure you have the right streaming permissions before publishing). This means you’re no longer limited to building streaming projects to the default XSA space, and don’t have to use the default generated workspace names.
Once you enter your connection details once, they’re saved for the session. Next time you publish, you just need to enter your password again.
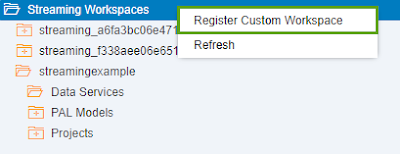
If this workspace isn’t on the streaming runtime tool yet, it won’t publish to the tool automatically. However, you can also register any streaming workspace (from any streaming server) on the streaming runtime tool. Then, it functions as any other streaming runtime tool workspace, where you can view projects, data services, and PAL models.
If you’ve used the streaming runtime tool and the SAP Web IDE for streaming development before this release, you probably also know the struggle of getting data services and PAL models set up. Before, you had to publish an incomplete (but working) project to create a runtime tool workspace, then add your data services and models, and finally go back to the Web IDE to continue developing the project. With this feature, the first step of that process is gone – there’s now a “Streaming Workspaces” folder in the streaming runtime tool by default, where you can register a workspace and add whatever you need before even starting development.
Using the monitor and event tracer
If you’ve developed and tested streaming projects in the HANA studio in the past, you might be familiar with the monitor and event tracer. In the streaming runtime tool, you can open either of them by right-clicking on a project, then selecting the relevant view.
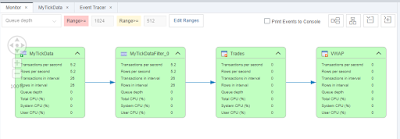
The monitor gives you a breakdown of what’s going on in every stream and window in your project. Each element is represented by a rectangle with a list of statistics: rows and transactions per second, the amount of CPU usage, and a bunch of other useful information. You can set thresholds for acceptable values, for either queue depth or rows per second, so that the relevant stream or window changes color whenever it passes the thresholds – a quick visual indicator if something is going wrong.
The event tracer is a simpler tool that gives you a high-level overview of the project. Here, you can see data flow, again represented by different colored shapes, though this time by event type.
