To understand the data aging in detail we will go a little bit deeper in this part of the blog series.
As example we will use table CDPOS. Data aging is in use and aging runs already were executed. As result we get this data distribution.
As example we will use table CDPOS. Data aging is in use and aging runs already were executed. As result we get this data distribution.
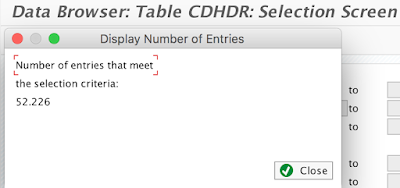
So if we select the record count via SE16 we will get the following result:
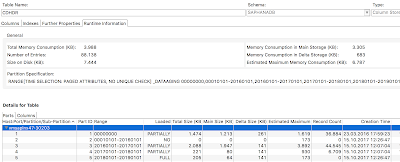
Here we can see the partitioning attributes and the record count of each partition
=> all partitions are loaded partially like mostly in business time
=> we also see the partitiong as configured in the ABAP backend
SQL Test
Now we will check different statements (also with count clause):
1) select * from CDHDR;
2) select * from CDHDR where MANDANT='100';
3) select * from CDHDR with RANGE_RESTRICTION ('CURRENT')
4) select * from CDHDR where MANDANT='100' with RANGE_RESTRICTION ('2016-11-01');
5) select * from CDHDR where MANDANT='100' with RANGE_RESTRICTION ('0001-01-01');
6) select * from CDHDR where MANDANT='100' with RANGE_RESTRICTION ('CURRENT');
7) select * from CDHDR with RANGE_RESTRICTION ('0001-01-01');
Test results
| Row Count | |
| SQL1 | 88.138 |
| SQL2 | 52.226 |
| SQL3 | 36.884 |
| SQL4 | 51.281 |
| SQL5 | 52.226 |
| SQL6 | 972 |
| SQL7 | 88.138 |
=> interesting is, that you can achive the same results with and without the range partitioning – which should not work if we can believe the SAP notes
DBACockpit => Diagnostics => SQL Editor
=> here you can also save the execution plan and import it into HANA Studio for a detailed analyses
Details – Plan viz
SQL1
=> we see a search without filters on all partitions
=> the exec plan is identically to SQL7 => no dynamic search is used here
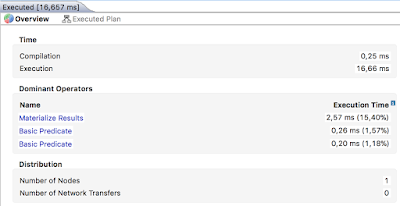
=> time spend for all parts are pretty low, because some of them are loaded into memory and the row count is also pretty low
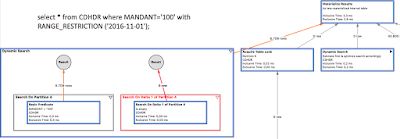
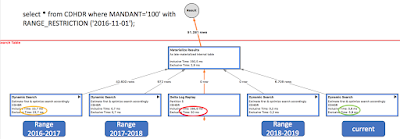
SQL4
=> now we see a dynamic search in cause of using the range restriction
=> but this time not on partition 2 (00010101 – 20160101)
=> closer look into the dynamic search
=> we see the filter on MANDANT on main and delta store of the partition 4
Same query with unloaded partitions besides current (part id 1)
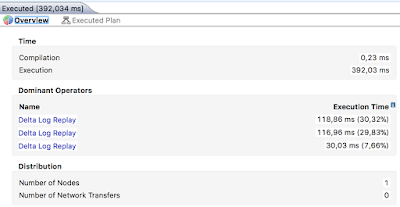
=> in the overview we see that the expensive part is on a new operator ‘Delta Log Replay’
=> the select on the current partition is still fast
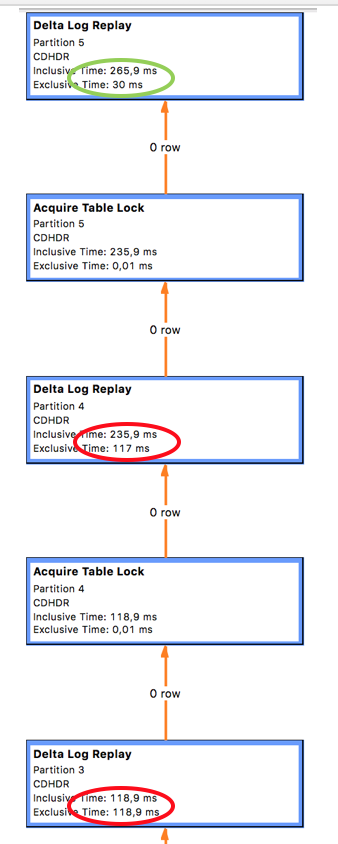
=> but on the unloaded partitions there must be executed a delta log replay on first access/load
=> the expensive ones are partition 3 and 4
=> so if you have big partitions which are not accessed frequently you can run into performance issues on first access
=> 3,3ms (loaded partitions) vs. 292,5ms (first access on historical partitions) = factor 97 slower
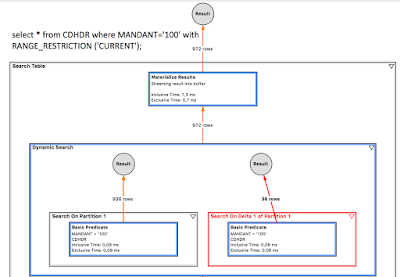
SQL6
=> on the current partition we see also the dynamic search with the select on both parts (main/delta) – this time with some results on the delta store


