Data drives the business processes we all rely upon, yet in many organizations poor quality data causes inefficiencies that could be avoided. SAP Data Hub includes various data quality operators that allow data pipelines to be created that can improve the quality of data in motion, or at rest.
In Data Hub 2.5.1 the set of data quality operators includes anonymization, data masking, location services (address cleansing, geocoding, and reverse geocoding), and validation.
This article shows how to use the validation operator to apply a data quality rule and to trigger a business process for data that fails the rule. It demonstrates how to use the SAP HANA Monitor and Validation Rule operators, tracing data using the Wiretap and Terminal operators, and extending a blank JavaScript operator.
To create our source HANA table, we executed the following DDL via HANA Studio.
CREATE COLUMN TABLE SVCROPRODUCT.JOURNEY (
ID INT PRIMARY KEY,
SOURCE NVARCHAR(10),
CUSTOMER NVARCHAR(30),
TIME_START TIMESTAMP,
TIME_END TIMESTAMP,
DISTANCE INT
);
In this example, new rows inserted into this table will be checked to ensure that the journey start time is before the end time, and if it is not, start a remediation process to correct the data.
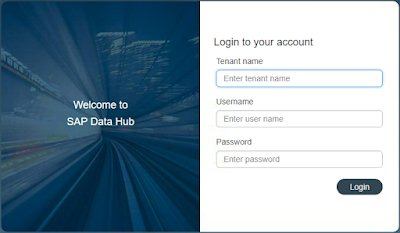
To logon to the Data Hub Launch Pad, you will require your tenant name, username and password.
In Data Hub 2.5.1 the set of data quality operators includes anonymization, data masking, location services (address cleansing, geocoding, and reverse geocoding), and validation.
This article shows how to use the validation operator to apply a data quality rule and to trigger a business process for data that fails the rule. It demonstrates how to use the SAP HANA Monitor and Validation Rule operators, tracing data using the Wiretap and Terminal operators, and extending a blank JavaScript operator.
Creating the data source
We will use a HANA table as the data source for this example, although the data could be read from anywhere that Data Hub supports, which includes databases, cloud storage, streams, applications and APIs.To create our source HANA table, we executed the following DDL via HANA Studio.
CREATE COLUMN TABLE SVCROPRODUCT.JOURNEY (
ID INT PRIMARY KEY,
SOURCE NVARCHAR(10),
CUSTOMER NVARCHAR(30),
TIME_START TIMESTAMP,
TIME_END TIMESTAMP,
DISTANCE INT
);
In this example, new rows inserted into this table will be checked to ensure that the journey start time is before the end time, and if it is not, start a remediation process to correct the data.
Configure a connection from Data Hub to HANA
To logon to the Data Hub Launch Pad, you will require your tenant name, username and password.
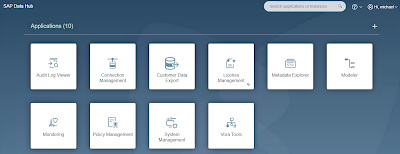
Once logged in, the Launch Pad displays tiles for the tenant applications.
In this demonstration we will use Connection Management to configure a connection to the source HANA system. While this is not necessary as connections can be configured in the modeler, connections created via Connection Management are reusable in the modeler and can also be used in the Metadata Explorer to browse and catalog metadata, and to view and profile data.
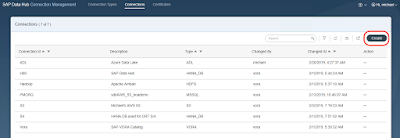
Click on the Connection Management tile to open the application, then click Create.
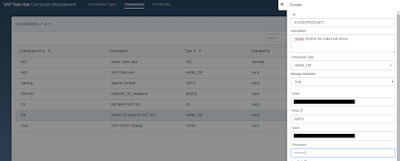
Enter your HANA system connection information.
Once saved, click the ellipsis against the new connection and select Check Status to ensure Data Hub can connect.
Creating the Graph
Switch back to the Launch Pad and click on the Modeler tile to launch the Modeler.
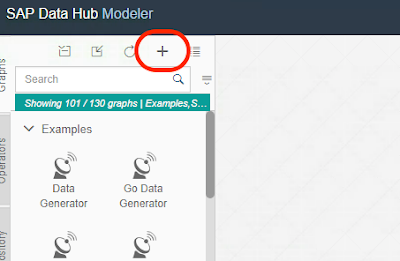
Click the + (in the top left) to create a new graph.
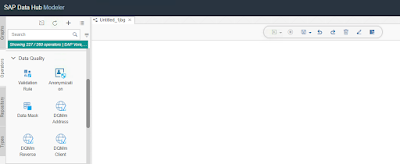
A new graph will be created, and rather conveniently the operators tab is selected.
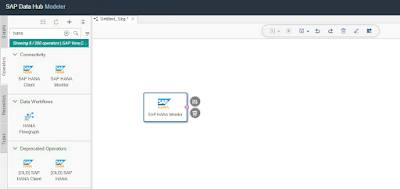
Operators can be added to a graph by double-clicking on them or dragging them into the graph editor. If you know the operator name you can use the search box. Locate the SAP HANA Monitor operator and add it to the graph.
The HANA Monitor operator continuously captures new data inserted into a table. It works by creating a trigger on the source table which inserts data into a shadow table, and polling the shadow table, we’ll look at those later.
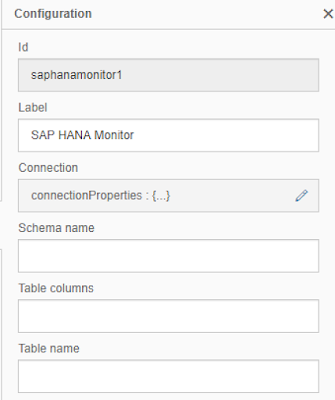
Open the operator configuration panel by clicking on the Open Configuration button.
We must configure the connection, schema name, table columns and table name. We can reuse the connection we created in the Configuration Management application. Click on the Connection property to open the property editor.
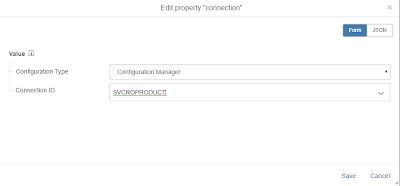
Select Configuration Manager as the Configuration Type and the Connection ID of the previously created connection.
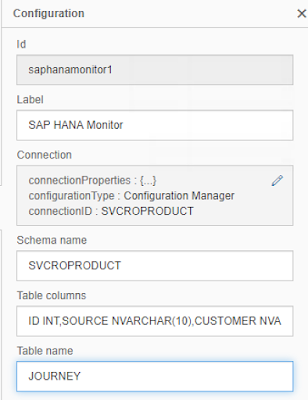
Enter the schema name and table name of the source table. Table columns is a comma separated list of column name and data type of the source table columns you want to monitor, so for the source table we created we will use
ID INT,SOURCE NVARCHAR(10),CUSTOMER NVARCHAR(30),TIME_START TIMESTAMP, TIME_END TIMESTAMP,DISTANCE INT
The completed monitor configuration.
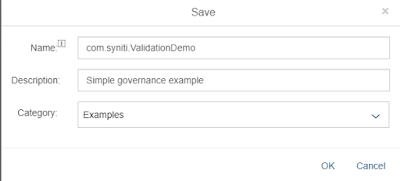
A great feature of Data Hub is that you can execute a graph before it is complete, this allows for incremental development and instant gratification! Save the graph using the Save button on the Editor toolbar.
You must provide a name, a Description is optional, Category allows graphs to be grouped in the navigation pane.
Now that the graph is saved, it can be run using the run button on the editor toolbar.
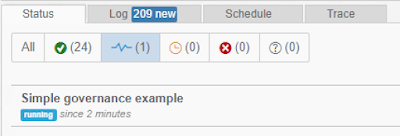
The bottom pane shows that the graph is running.
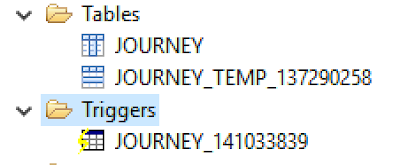
Switching to HANA Studio, we can see that a shadow table and a trigger have been created to capture new rows. These are created and deleted by the operator during startup and shutdown of the graph.
If we now inserted new data into the source table, the trigger would copy it to the shadow table and the graph would process the new data. However, as our graph is very simple we have no way of seeing what’s happening, that’s not gratifying at all!
Tracing and Debugging
When testing and debugging graphs it is often useful to trace the data output by operators. There are 2 operators that can be used for this, Wiretap and Terminal. We’ll use Wiretap to display the data output by the HANA Monitor operator.
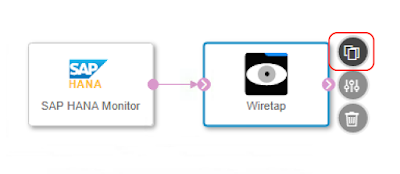
Add the Wiretap operator to the graph and connect the output port of the HANA Monitor to the input port of the Wiretap.
Save and run the graph. Once the graph is running another option appears for the wiretap instance, an Open UI button.
Click on the Open UI button, a new browser window will open.
Back in HANA Studio, we insert a new row into the source table.
INSERT INTO JOURNEY VALUES (1, 'openCAB', 'Michael',
TO_TIMESTAMP('18-02-2019 10:00:00', 'DD-MM-YYYY HH24:MI:SS'),
TO_TIMESTAMP('18-02-2019 11:00:00', 'DD-MM-YYYY HH24:MI:SS'), 10);
The wiretap window now shows the inserted data, gratification at last!
The data output is
[{"CUSTOMER":"Michael","DISTANCE":10,"ID":1,"SOURCE":"openCAB","TIME_END":"2019-02-18 11:00:00","TIME_START":"2019-02-18 10:00:00"}]
The {} notation shows that the operator output format is JSON, and the [] hints that multiple objects may be output. Let’s insert multiple rows to see what happens.
INSERT INTO JOURNEY VALUES (2, 'openCAB', 'Matt',
TO_TIMESTAMP('18-02-2019 10:12:00', 'DD-MM-YYYY HH24:MI:SS'),
TO_TIMESTAMP('18-02-2019 11:11:00', 'DD-MM-YYYY HH24:MI:SS'), 10);
INSERT INTO JOURNEY VALUES (3, 'openCAB', 'Tyler',
TO_TIMESTAMP('18-02-2019 12:00:00', 'DD-MM-YYYY HH24:MI:SS'),
TO_TIMESTAMP('18-02-2019 12:30:00', 'DD-MM-YYYY HH24:MI:SS'), 10);
The data output is
[{"CUSTOMER":"Matt","DISTANCE":10,"ID":2,"SOURCE":"openCAB","TIME_END":"2019-02-18 11:11:00","TIME_START":"2019-02-18 10:12:00"},{"CUSTOMER":"Tyler","DISTANCE":10,"ID":3,"SOURCE":"openCAB","TIME_END":"2019-02-18 12:30:00","TIME_START":"2019-02-18 12:00:00"}]
While this is not easily human readable, its an array of JSON objects, showing that the HANA Monitor will capture multiple rows during each poll and the output of the operator is a single message containing multiple rows.
Using JavaScript to format data
The JSON output from the HANA Monitor must be converted to CSV before being sent to the Validation Rule operator. The Format Converter operator can be used in some cases, but we’ll demonstrate manual conversion which would be required for complex formatting.
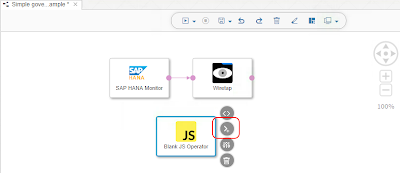
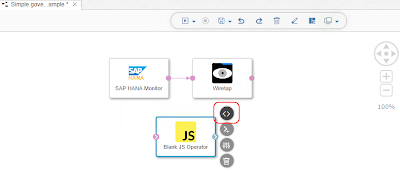
Stop the graph, then add a Blank JS Operator, we’ll use JavaScript, but we could use the Go or Python operators to format the data.
In general, operators are data processors. They accept data on input ports, process it, then produce data on their output ports. Operators can have multiple input and output ports, and ports support various data types. The delivered operators have predefined ports for their specific purpose, but when creating or extending an operator, we must configure its ports. In our example we’ll match the input port to the output port of the HANA Monitor, and use a string datatype for the output CSV, as this is the input port type on the Validation Rule operator.
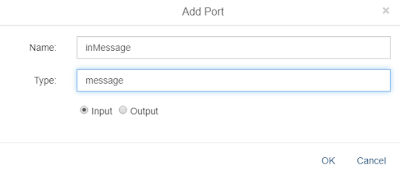
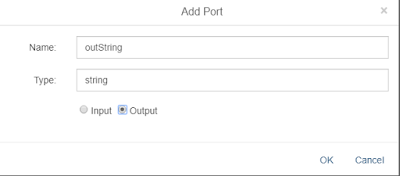
Click on the Add Port button on the Blank JS Operator.
Add an input port called inMessage.
Add an output port called outString.
Click on the Script button to open the script editor.
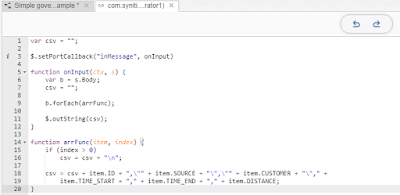
Paste in the following JavaScript.
var csv = "";
$.setPortCallback("inMessage", onInput)
function onInput(ctx, s) {
var b = s.Body;
csv = "";
b.forEach(arrFunc);
$.outString(csv);
}
function arrFunc(item, index) {
if (index > 0)
csv = csv + "\n";
csv = csv + item.ID + ",\"" + item.SOURCE + "\",\"" + item.CUSTOMER + "\"," +
item.TIME_START + "," + item.TIME_END + "," + item.DISTANCE;
}
The script registers a function to be called when data arrives on the input port. The function formats the data and sends it to the output port.
In the graph editor, edit the graph so that the output port of the HANA Monitor is connected to the input port of the JavaScript operator, and the wiretap is connected to the JavaScript output.
Save and run the graph, then insert some data into the source table. The wiretap output should now show that the JSON data has been formatted as CSV data.
Applying a Data Quality rule
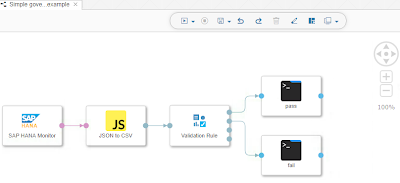
The Validation Rule operator allows us to specify multiple rules that route data to pass or fail output ports. The rule we’ll apply is simple, a journey start time must be before the journey end time.
Stop the graph and remove the Wiretap operator. Add a Validation Rule operator, and 2 Terminal operators. Connect the Validation operator to the output of the JavaScript operator, and the Terminals to the pass and fail output ports on the validation operator. An operator’s label can be edited to be more descriptive, so we’ll do that as well.
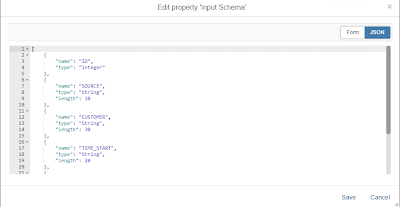
In the validation operator configuration we must specify the structure of the incoming CSV data. This can be done using a form to enter each element or as JSON. The JSON to describe the input schema is shown below.
[
{
"name": "ID",
"type": "Integer"
},
{
"name": "SOURCE",
"type": "String",
"length": 10
},
{
"name": "CUSTOMER",
"type": "String",
"length": 30
},
{
"name": "TIME_START",
"type": "String",
"length": 20
},
{
"name": "TIME_END",
"type": "String",
"length": 20
},
{
"name": "DISTANCE",
"type": "Integer"
}
]
We can simply paste that into the property editor.
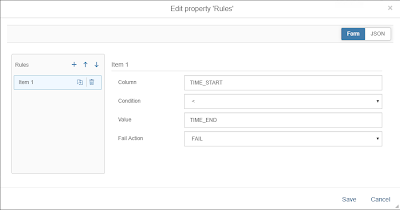
The Rules property allows us to specify simple rules. The column names used in the rules are from the previous step, where we defined the input schema.
Our basic rule is defined as shown below. TIME_START < TIME_END.
Save and run the graph. Once the graph has started open the UI for the 2 terminals, they will open new browser windows.
Now let’s insert some data into the source table that will pass the rule. TIME_START is 10AM, and TIME_END 11AM, which satisfies our rule.
INSERT INTO JOURNEY VALUES (1, 'openCAB', 'Michael',
TO_TIMESTAMP('18-02-2019 10:00:00', 'DD-MM-YYYY HH24:MI:SS'),
TO_TIMESTAMP('18-02-2019 11:00:00', 'DD-MM-YYYY HH24:MI:SS'), 10);
The terminal connected to the pass port shows the data.
If we enter some data that fails the rule, for example if the start and end time are the same due to an upstream mapping error where the same data is mapped to both columns, the data is displayed in the terminal connected to the fail port.
Great, our rule works and the failed data is captured.
Completing the graph
We want to send the failed data to a separate governance platform that can control the remediation process. The third party platform has a REST API that we can use to start the governance process, so we’ll use an HTTP Client operator to perform an HTTP POST of the failed data. The REST API requires the data to be in JSON format so we can use a Format Converter operator to convert the failed data CSV to JSON. The completed graph is shown below.
