Some ABAPers might have already noticed this button “Graphical Explain” in tcode ST05 but do not know how to use it properly.
First you can switch on SQL trace via tcode ST05:
And execute the program you want to trace in another SAPGUI window. Once finished, deactivate the trace in ST05.
And press this button to display the trace.
Use this menu to export the execution plan of a given SQL statement into a local file (.plv ):
Then open it via HANA Studio:
Then the execution plan could be displayed in detail as a graph:
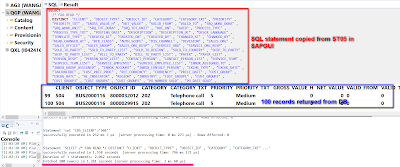
You can even paste the SQL statement you observed in ST05 into HANA Studio and execute it there:
Just open SQL Console, paste the source code and press F8 to execute:


